Keywords
Keywords
1.Average free energy (AFE) of a fragment
The average free energy of a double stranded DNA molecule can be expressed in terms of the free energy of its constituent base paired dinuleotides. Average free energy is determined by the summation of free energy for a sliding window of 15 base pair length over any stretch of DNA sequences.
2. E
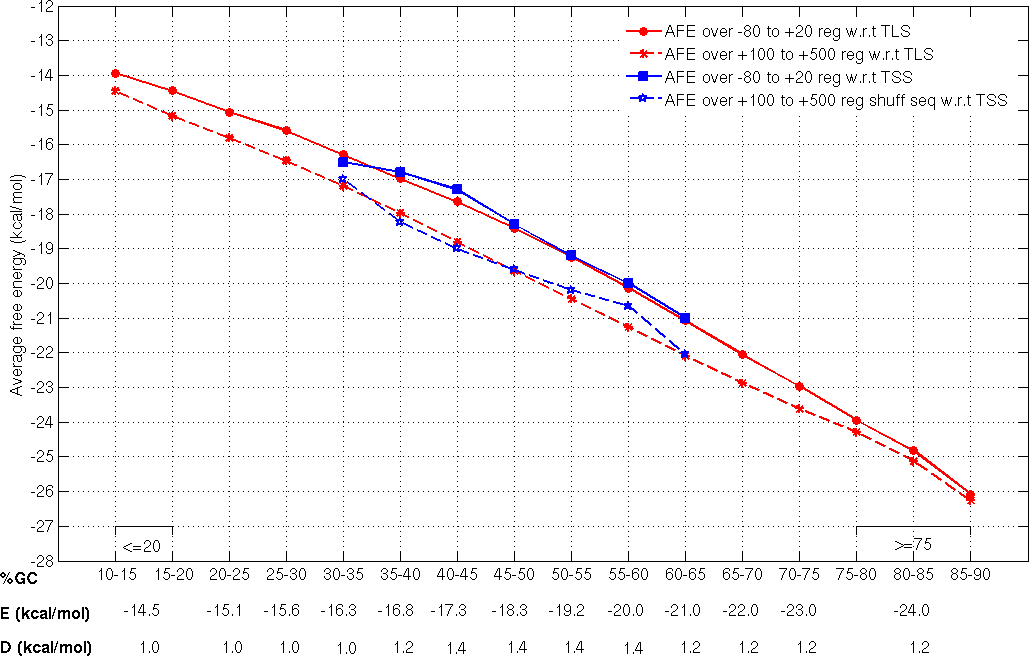
Average free energy over promoter sequences of 101nt length (spanning the region from -80 to +20 with respect to TLS). It is one of the two threshold values defined for each 5% interval of %GC-content to predict promoter region over any given genomic sequence.
3. D
The difference between E and the average free energy (REav) over the downstream (+100 to +500 w.r.t TLS) shuffled sequence. It is the other threshold value defined to predict promoter region over any given genomic sequence.
4. Least stable window center
Center position of the 15nt window within a predicted region, which has highest free energy (less stable).
5. DE
Difference in free energy or stability of neighboring regions of 100nt length with a 50nt interval between them in a genomic fragment.
6. DEmax position
Position of the highest DE value within a predicted region.
7. PP_DEave
The average DE value for each individual predicted promoter region.
8. WPP_DEave
The average DE values for all predicted regions in a particular genome.
9. Prediction Reliability
Low, Medium, High, Very high and Highest are the reliability prediction level classifications based on the comparison of PP_DEave with WPP_DEave.

Methods
Promoter prediction methodology
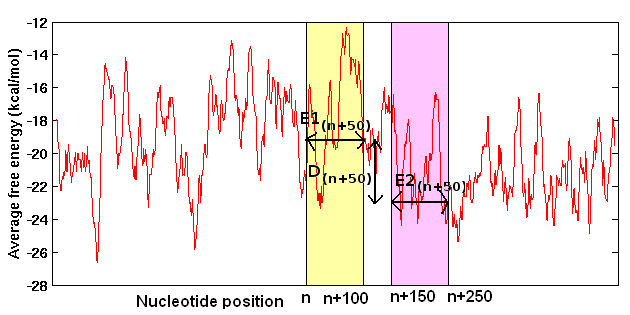
The average free energy (E) over known promoter sequences and the difference (D) between E and the average free energy over downstream random sequences (REav) are used to search for promoters in the genomic sequences. Difference in free energy (DE(n+50)) or stability of neighboring 100nt regions are calculated and compared with the assigned cutoff (obtained from the energy difference between upstream and downstream regions in the vicinity of known TSS), to predict promoters in genomic DNA sequences (Rangannan V and Bansal M 2007; Rangannan V and Bansal M 2009). The following figure illustrates the promoter prediction methodology applied corresponding to nucleotide position 'n'.

Free energy (stability) calculation
The stability of a double stranded DNA molecule can be expressed as sum of free energy of its constituent base paired dinucleotides. In the present study free energy over a long continuous stretch of DNA sequence was calculated by dividing the sequence into overlapping windows of 15 base pairs (or 14 dinucleotide steps). The energy values corresponding to the 16 dinucleotide steps (10 unique dinucleotide) are taken from the unified parameters obtained from melting studies on 108 oligonucleotides (Allawi and SantaLucia 1997; SantaLucia 1998).
Dinucleotide
step |
Free energy
(kcal/mol) |
AA |
-1.0 |
TT |
-1.0 |
AT |
-0.88 |
TA |
-0.58 |
CA |
-1.45 |
TG |
-1.45 |
AC |
-1.44 |
GT |
-1.44 |
CT |
-1.28 |
AG |
-1.28 |
GA |
-1.30 |
TC |
-1.30 |
CG |
-2.17 |
GC |
-2.24 |
GG |
-1.84 |
CC |
-1.84 |
Threshold calculation
Promoter sequences of 1001nt length and corresponding to TSSs which are atleast 500nt apart and associated with protein coding genes, from three different bacteria (E. coli, B.subtilis and M. tuberculosis) were categorized on the basis of their GC composition (at 5% GC intervals).
E, the average free energy over -80 to +20 region and REave, the average free energy over the +100 to +500 region with respect to
the known TSS
with defined ranges of GC-content are the two parameters used to discriminate promoter regions from non-promoters and were considered to derive the threshold values E and D (where, D = E-RE av) (Rangannan V and Bansal M 2009). For the fragments with the extreme GC-content (<35% or >60%), for which experimentally annotated TSS information is not available threshold values have been derived using the TLS data from 913 microbial genomes (Rangannan V and Bansal M 2010).
Thus the threshold values (TSS-TLS derived cutoff values) have been calculated for genomic DNA with varying GC-content (also given in the following figure) and have been applied to annotate for promoter regions in all bacterial genome sequences.

True positive (TP) and false positive (FP) definition with respect to the gene translation start point (TLS)
If a predicted promoter region (PP) falls within or overlaps by atleast 20 nt with the 500 nt upstream region of a gene, we call it as a true positive (TP).
If a predicted promoter region (PP) does not satisfy true positive criteria and lies entirely within the coding region of a gene in the same direction as transcription, we call it as a false positive (FP).
While looking at the distribution of predicted promoter regions within the coding region, a predicted signal is considered to lie within a gene, irrespective of the transcription direction of the gene.
Method for curvature calculation
Curvature for DNA sequences has been calculated using in-house software NUCGEN (Bansal M et al. 1995). Dinucleotide parameters based on crystal structure data of oligonucleotides (CS model) (Bansal M 1996) and on relative gel mobility data (BHMT model) (Bolshoy A et al. 1991) have been used to calculate the curvature. For a promoter sequence of length ‘ n’ and with a window size ‘ w’ = 75 bp, curvature has been obtained for ( n − w + 1) number of DNA fragments. Ratio of end-to-end distance ‘ d’ to the contour length ‘ l max’ along the path traced by the DNA molecule ( d/ l max) has been plotted as curvature profile with respect to the nucleotide position (Kanhere A and Bansal M 2005a).
Method for bendability calculation
Bendability has been calculated using two tri nucleotide models, DNase I sensitivity (Brukner I et al. 1995) and Nucleosomal positioning preference (Satchwell SC et al. 1986). The bendability profiles are calculated by looking up the values of trinucleotide parameters corresponding to each consecutive overlapping trinucleotides in the sequence (Kanhere A and Bansal M 2005a). The bendability profiles were smoothened over a 30nt window.
Database content
NCBI Reference table
This table gives the details about the NCBI accession number, clade, organism name with strain, size of the genome, GC composition, percentage of coding region and number of genes along with the gene product information, for all the microbial genomes available in PromBase.
Analysis of Genomic features
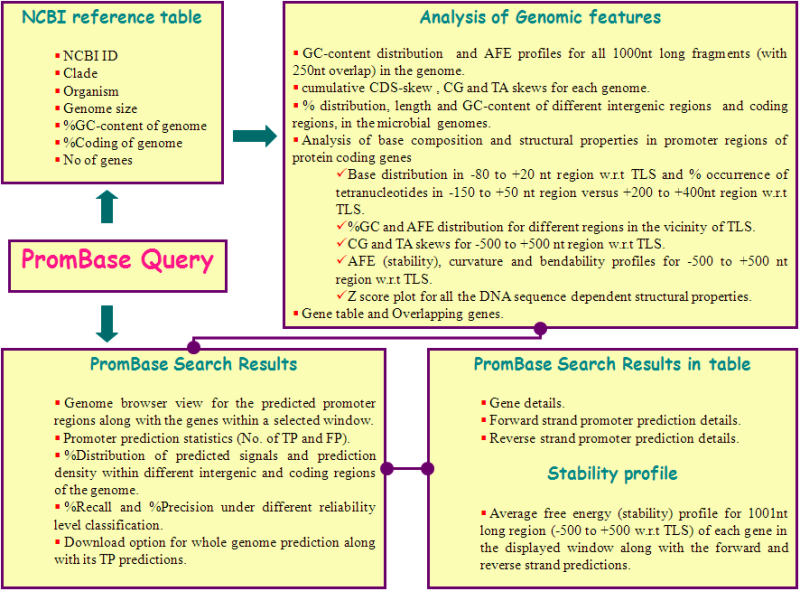
This page provides
the genome details inferred from each genome, such as %GC content distribution and average free energy profiles for all 1000nt long fragments (with 250nt overlap) in the genome, cumulative CDS-skew as well as CG and TA skews for each genome, %nucleotide distribution, length and %GC content of coding as well as tandem, convergent and divergent intergenic regions. In addition, PromBase analyses the DNA sequence and sequence dependent structural properties for 1001nt long genomic region (spanning -500 to +500nts aligned with respect to the translation start point of protein coding genes).
Predicted Promoter region search results
Position
specific or gene name specific search results for predicted promoter regions, along with gene information, within a variable size window selected is displayed pictorially and is also available in tabular form.
The database also correlates the predicted promoter regions with gene information in terms of true positive and false positive, depending on their location. PromBase also plots the average free energy profile over 500nt flanking region with respect to TLS of each of the gene in the displayed window.
The Following figure illustrates the information content available in PromBase.

Relational database schema
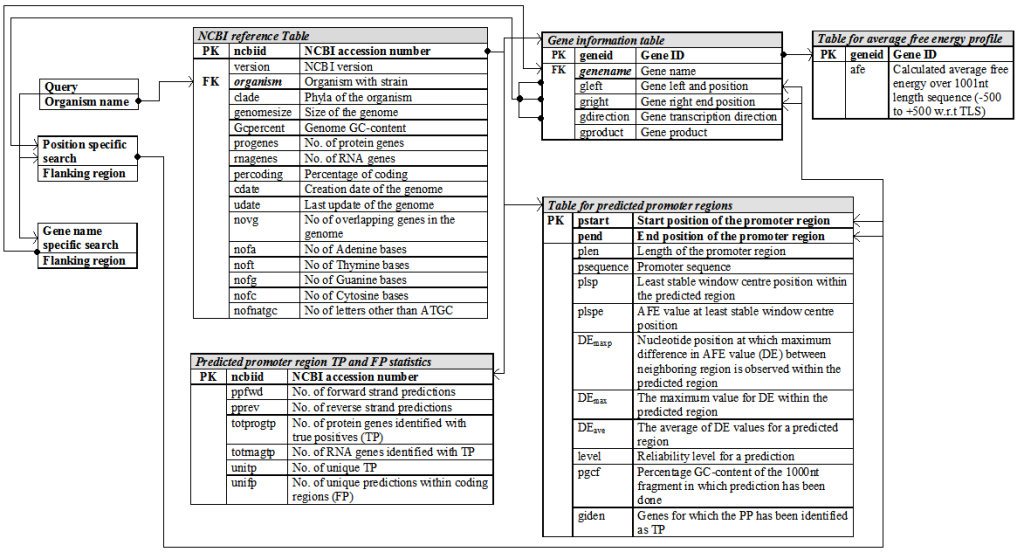
PromBase was developed using MySQL, a relational database management system that serves as the backend for storing data. Following figure shows the relational database schema used for developing PromBase. Separate tables were maintained for the gene and predicted promtoer region details in each microbial genome.

For more details on PromBase, please refer Rangannan and Bansal 2011.
References
-
Allawi H T and SantaLucia J Jr 1997
Thermodynamics and NMR of internal G.T mismatches in DNA; Biochemistry 36:10581-94.
-
Bansal M, Bhattacharyya D and Ravi B 1995
NUPARM and NUCGEN: software for analysis and generation of sequence dependent nucleic acid structures.
Comput Appl Biosci,
11(3):281-287. (
PDF)
-
Bansal M 1996
Structural variations observed in DNA crystal structures and their implications for protein-DNA interactions. in Biological structure and Dynamics, Proceedings of the Ninth Conversation,
I:121-134. Eds. R. H. Sarma and M. H. Sarma (New York : Adenine Press).
-
Bolshoy A, McNamara P, Harrington RE, Trifonov EN 1991
Curved DNA without A-A: experimental estimation of all 16 DNA wedge angles.
Proc Natl Acad Sci U S A,
88(6):2312-2316.
-
Brukner I, Sanchez R, Suck D, Pongor S 1995
Trinucleotide models for DNA bending propensity: comparison of models based on DNaseI digestion and nucleosome packaging data.
J Biomol Struct Dyn,
13(2):309-317.
-
Kanhere A and Bansal M 2005a
Structural properties of promoters: similarities and differences between prokaryotes and eukaryotes; Nucleic Acids Res.33:3165-3175. (
PDF)
-
Kanhere A and Bansal M 2005b
A novel method for prokaryotic promoter prediction based on DNA stability; BMC Bioinformatics 6:1.(
PDF)
-
Rangannan V and Bansal M 2007
Identification and annotation of promoter regions in microbial genome sequences on the basis of DNA stability; J. Biosci. 32(5):851-862. (
PDF)
-
Rangannan V and Bansal M 2009
Relative stability of DNA as a generic criterion for promoter prediction: whole genome annotation of microbial genomes with varying nucleotide base composition; Mol. BioSyst. 5:p1758 - 1769. (
PDF)
-
Rangannan V and Bansal M 2010
High Quality Annotation of Promoter Regions for 913 Bacterial Genomes; Bioinformatics, 26(24):p3043 - 3050.
-
Rangannan V and Bansal M 2011
PromBase: A web resource for various genomic features and predicted promoters in prokaryotic genomes. (manuscript submitted).
-
SantaLucia J Jr 1998 A unified view of polymer, dumbbell, and oligonucleotide DNA nearest-neighbour thermodynamics; Proc. Natl. Acad. Sci.e USA 95:1460-5.
-
Satchwell SC, Drew HR, Travers AA 1986
Sequence periodicities in chicken nucleosome core DNA.
J Mol Biol,
191(4):659-675.


