Keywords
1. Average
free energy of DNA fragment
The free energy (stability) of a
double stranded DNA molecule can be expressed in terms of the free energy
of its constituent base paired dinucleotides.Average free energy is determined
by the summation of free energy for a sliding window of 15 base pair length
over any stretch of DNA sequence.
2. DNA stability
DNA stability is a sequence dependent
property and depends on the sum of interaction energy between the constituent
nucleotides.
3. E
Average free energy over promoter
sequences of 100nt length (spanning the region from -80 to +20 with respect
to known TSSs).
4. D
The difference between E and the
average free energy (REav) over the downstream (100 to 500 w.r.t TSS) shuffled
sequence.
Introduction
Analysis of various predicted
structural properties of promoter regions in prokaryotic as well as eukaryotic
genomes indicates that they have several common features, such as lower
stability, higher curvature and less bendability, when compared with their
neighboring regions. Based on the difference in stability between neighboring
upstream and downstream regions in the vicinity of experimentally determined
transcription start sites (TSS), a promoter prediction algorithm (PromPredict)
has been developed to identify promoter regions in prokaryotic genomic
DNA (Kanhere A and Bansal M 2005a, 2005b).
Promoter Prediction
Methodology
The average free energy (E)
over known promoter sequences and the difference (D) between E and the average
free energy over downstream random sequences (REav) are used to search for
promoters in the genomic sequences. Difference in free energy or stability of
neighboring regions are calculated and compared with the assigned cutoff
(obtained from the energy difference between upstream and downstream regions in
the vicinity of known TSS), to predict promoters in genomic DNA sequences
(Rangannan V and Bansal M 2007, 2009).
Free energy (stability)
calculation
The stability of a double
stranded DNA molecule can be expressed as sum of free energy of its constituent
base paired dinucleotides. In the present study free energy over a long
continuous stretch of DNA sequence was calculated by dividing the sequence
into overlapping windows of 15 base pairs (or 14 dinucleotide steps). The
energy values corresponding to the 16 dinucleotide steps (10 unique dinucleotide)
are taken from the unified parameters obtained from melting studies on
108 oligonucleotides (Allawi and SantaLucia 1997; SantaLucia 1998).
| Dinucleotide step |
Free energy(kcal/mol) |
| AA |
-1.0 |
| TT |
-1.0 |
| AT |
-0.88 |
| TA |
-0.58 |
| CA |
-1.45 |
| TG |
-1.45 |
| AC |
-1.44 |
| GT |
-1.44 |
| CT |
-1.28 |
| AG |
-1.28 |
| GA |
-1.30 |
| TC |
-1.30 |
| CG |
-2.17 |
| GC |
-2.24 |
| GG |
-1.84 |
| CC |
-1.84 |
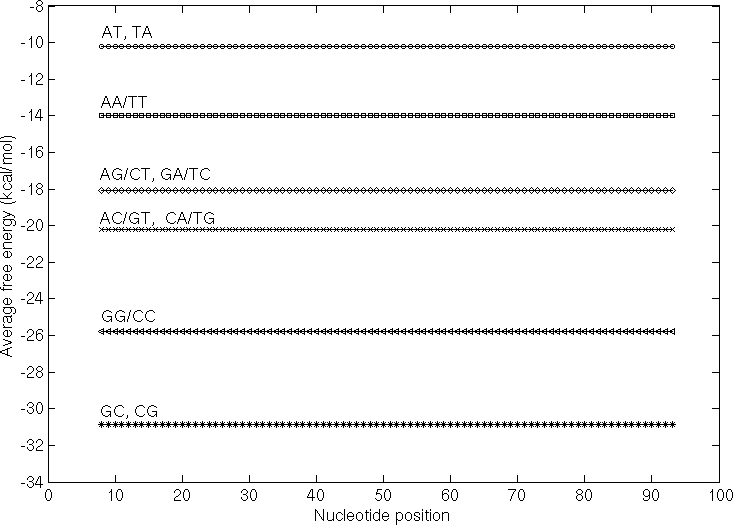
The following figure illustrates the variation observed in average free energy (AFE) based on dinucleotide composition in sequences 101nt length and containing repeats of dinucleotides. The average free energy has been calculated for 15-mer fragments and plotted for each sequence.

Threshold calculation
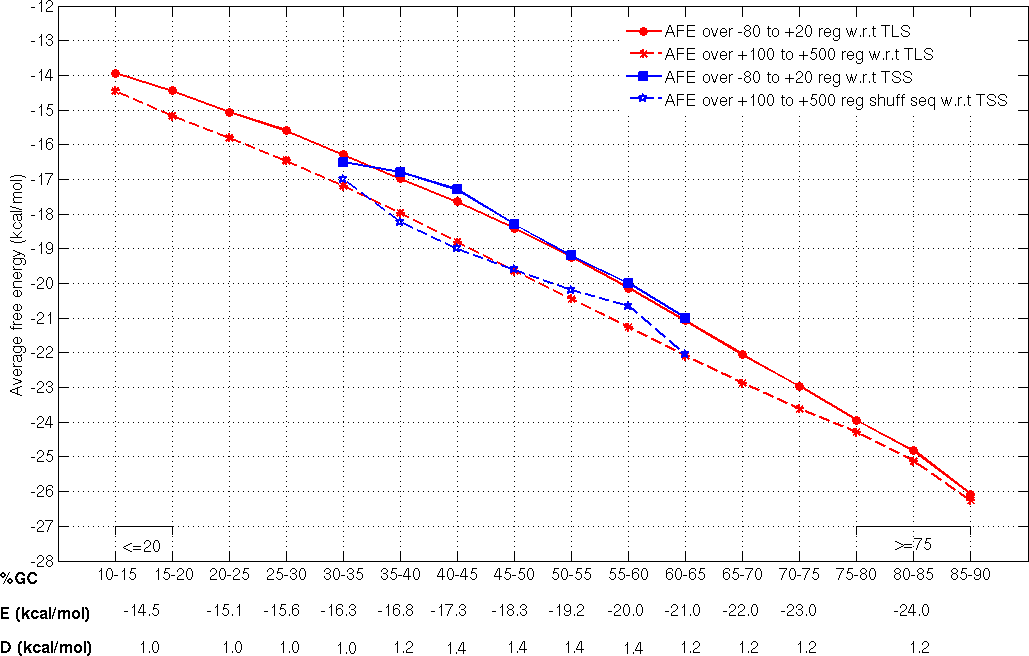
Promoter sequences of 1001nt length and corresponding to TSSs which are atleast 500nt apart and associated with protein coding genes, from three different bacteria (E. coli, B.subtilis and M. tuberculosis) were categorized on the basis of their GC composition (at 5% GC intervals). The average free energy (E) over the proximal promoter region (spanning -80 to +20 nt with respect to the TSS) and the average free energy (REav) over the shuffled sequences generated from the downstream region (+100 nt to +500 nt with respect to the TSS) of known TSS with defined ranges of GC content was calculated (Rangannan V and Bansal M 2009).
The cut-off values assigned for the AFE values 'E' for a 100 nt long fragment and the difference 'D' between the 'E' and the AFE for the downstream shuffled sequence (REav) from TSS dataset covers seven ranges of GC content (30 to 65 %GC at 5% intervals). These cut-off values have now been updated also to cover the extreame %GC range from 15 to 80% by including data from sequences flanking TLS in 913 microbial genomes (Rangannan V and Bansal M 2010). The TSS-TLS cut-off values used to predict promoter regions in given genome sequence is illustrated in the following figure.

Window size
Default window size
of 100nt is used to calculate E1 and corresponds to high sensitivity
as well as precision for identifying promoters. If no promoter signal is
identified then 50nt window can be specified to calculate E1.
References
1. Allawi H T and SantaLucia J Jr 1997 Thermodynamics and NMR of internal G.T mismatches in DNA; Biochemistry 36:10581-94. (PDF)
2. Kanhere A and Bansal M 2005a Structural properties of promoters: similarities and differences between prokaryotes and eukaryotes;
Nucleic Acids Res. 33:3165-3175. (PDF)
3. Kanhere A and Bansal M 2005b A novel method for prokaryotic promoter prediction based on DNA stability;BMC Bioinformatics 6:1. (PDF)
4.Rangannan V and Bansal M 2007 Identification and annotation of promoter regions in microbial genome sequences on the basis of DNA stability; J. Biosci. 32(5):851-862. (PDF)
5.Rangannan V and Bansal M 2009 Relative stability of DNA as a generic criterion for promoter prediction: whole genome annotation of microbial genomes with varying nucleotide base composition; Mol. BioSyst. 5:p1758 - 1769. (PDF)
6.Rangannan V and Bansal M 2010 High Quality Annotation of Promoter Regions for 913 Bacterial Genomes; Bioinformatics 26(24):p3043 - 3050.
7. SantaLucia J Jr 1998 A unified view of polymer, dumbbell, and oligonucleotide DNA nearest-neighbour thermodynamics;
Proc. Natl. Acad. Sci. USA 95:1460-5. (PDF) |